About Intrinsiqq
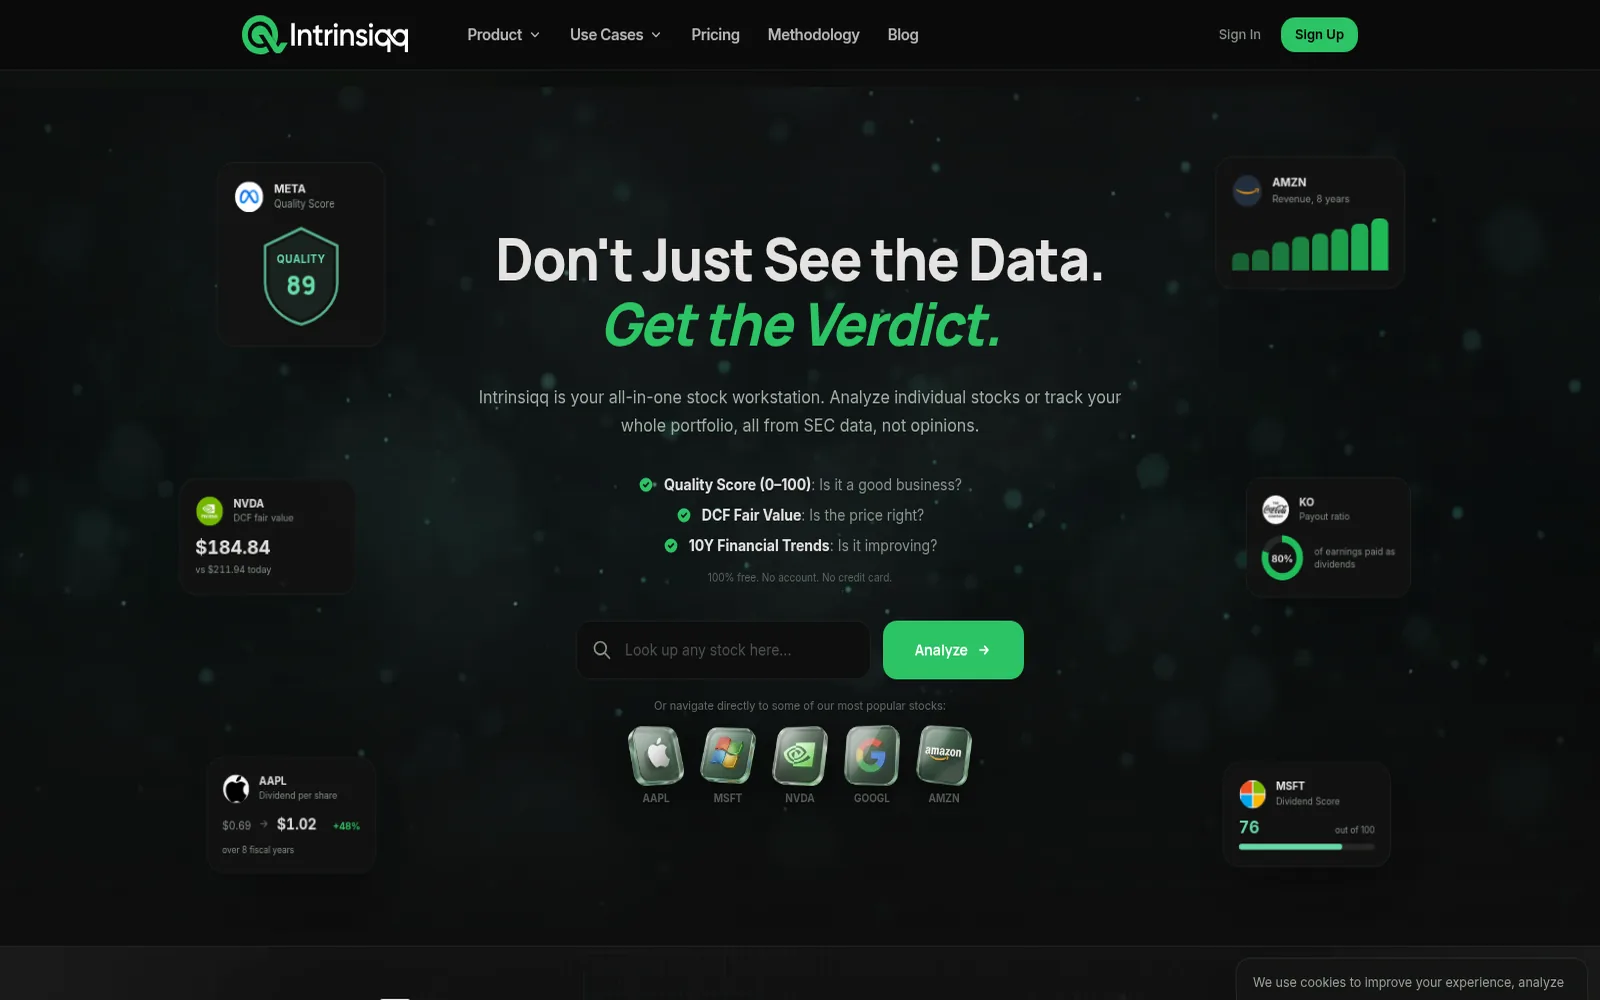
Intrinsiqq is an all-in-one stock workstation for self-directed investors who want a scored verdict, not another dump of raw ratios. Search a ticker and you get a Quality Score (0–100), a DCF fair-value estimate you can edit, dividend analysis, and a decade-plus of financials — computed from filings instead of analyst opinions.
The product pitch on Intrinsiqq’s site is blunt: don’t just see the data, get the verdict. Quality Score asks whether it is a good business. DCF fair value asks whether the price is right. Ten-year trends ask whether the business is improving. Core analysis is free to view with no account and no credit card. Paid plans unlock the screener, side-by-side compare, editable DCF sliders, advanced charting, and a portfolio tracker.
Intrinsiqq is operated by Philip van den Berge, trading as Intrinsiqq, a sole proprietorship in Rotterdam, Netherlands (KvK 73238007). The platform is a research tool only — not a broker, not a financial advisor, and not a buy/sell signal. Use it to organise public data, then verify important figures against the original filings and make your own decisions.
Key features
From Intrinsiqq’s live homepage, methodology, and pricing pages:
- Quality Score (0–100): a weighted blend of eight fundamental checks — earnings multiple (P/E), cash-flow multiple (P/FCF), revenue growth, free-cash-flow growth, share dilution, operating-margin trend, capital structure (net debt vs free cash flow), and ROIC. Every formula, threshold, and weight is published on the methodology page.
- Dynamic DCF: a two-stage free-cash-flow model with conservative, base, and optimistic scenarios. On paid plans you can edit growth, discount rate, terminal assumptions, and margin of safety, then see what growth rate the market is already pricing in. The model runs in the browser so the working is yours to stress-test — not a black-box price target.
- Dividend Score: a 0–100 composite of safety, growth, and income (weighted 40% / 35% / 25% on the methodology page). Payout is shown against both earnings and free cash flow, plus per-share history, growth streak, and CAGR. Companies that do not pay a dividend receive no dividend score.
- 10+ years of financials from SEC EDGAR: US statements are parsed from the SEC XBRL CompanyFacts API (10-K and 10-Q). Trailing-twelve-month figures are assembled from quarterly filings. Stock prices come from licensed market data providers (Intrinsiqq cites Twelve Data on the methodology page); US prices are described as real-time intraday, with some non-US listings delayed or end-of-day.
- Screener (Pro+): filter 10,000+ stocks across 30+ numeric filters — quality, valuation, margins, growth, returns, dividends, and size. Start from named quick screens (Quality Value, Dividend Champions, Wide Moat, Growth Compounders, and others) or build your own. Premium can re-weight the eight quality checks and re-rank the market against your weights.
- Compare (Pro+): line up up to 10 tickers and switch the metric underneath — scores, valuation, profitability, or cash flow — with the winner on each measure called out.
- Fundamental charting (Pro+): stack up to four metrics, switch area/line/bar/stacked/combo, flip annual vs quarterly or per-share vs year-over-year, and overlay price or P/E. Free charting is capped at a single metric and five years of history.
- Portfolio tracker (Premium): track cost basis, real returns, and dividend income across holdings, plus a position-weighted portfolio quality score, a fundamentals radar, a dividend calendar, and a 12-month income forecast. Holdings can be entered by hand or imported from a Trading 212, Scalable Capital, Interactive Brokers, or Robinhood CSV — Intrinsiqq does not connect live to your brokerage.
Coverage is 10,000+ companies across US and international markets. Where a company trades in several places, Intrinsiqq says it shows the home listing rather than a US depositary receipt. DCF is withheld when cash-flow data is not reliable enough — including some non-US filers — rather than publishing a fair value on weak inputs. Individual companies only: no ETF, mutual fund, or trust coverage.
Plans and pricing
From Intrinsiqq’s live pricing page (confirm totals at checkout; list prices can change):
- Free — $0/month: 10 stock lookups per day, 10 watchlist stocks, 5 years of financials, 10 price alerts, Dividend Score, DCF valuation (view only), fundamental charting (single metric, 5 years), chart export (PNG, JPG, PDF), watchlist, and earnings calendar. No credit card required to start.
- Pro — $11.99/month or $9.59/month billed annually ($115.08/year, marketed as 20% off vs monthly): unlimited stock lookups, unlimited screener runs (top 100 results), unlimited comparisons (10 stocks each), one watchlist with unlimited stocks, full financial history, editable DCF sliders, advanced multi-metric charting with price and valuation overlays, 20+ years of history and saved chart templates, 20 price alerts, and a PDF stock summary.
- Premium — $27.99/month or $22.39/month billed annually ($268.68/year): everything in Pro, unlimited, plus unlimited watchlists, unlimited alerts, the portfolio tracker (unlimited portfolios and holdings), position-weighted portfolio quality score, portfolio fundamentals radar, dividend calendar with a 12-month income forecast, and custom quality-score weights.
Cancel anytime from account settings. Access continues until the end of the period you already paid for. Intrinsiqq’s Terms (updated 9 July 2026) state that payments already made are generally non-refundable except where a refund is required by law. EU/UK consumers normally have a 14-day withdrawal right for distance contracts, but Intrinsiqq’s Terms say you request immediate performance of digital content and acknowledge that right is lost once performance begins.
SaveOnTrading’s partner offer is 20% off paid Pro and Premium plans with code SAVEONTRADING when you start from our referral page. On the current Pro monthly list price that is about $9.59/month before you choose annual billing — confirm the live checkout total. Free stays free. Intrinsiqq’s Terms say partner discount codes are not stackable with other promotions; eligibility, value, and expiry are shown at checkout.
Who it's for
Intrinsiqq is built for long-term, fundamentals-driven DIY investors:
- Value investors who want an editable DCF next to return on capital, not a single unexplained fair-value number
- Dividend investors who want payout coverage and growth streak, not a yield-sorted trap list
- Beginners who want eight checks explained in a sentence instead of forty unexplained ratios
- Anyone tired of bouncing between Yahoo Finance, a spreadsheet, and a $200/month terminal for a first-pass quality and valuation read
It is not designed for day traders, options strategies, or meme-stock speculation. There is no Level 2 tape, no options flow, and no broker. Banks, REITs, and pre-revenue companies may have less meaningful general quality scores — Intrinsiqq routes some of those sectors to different scorecards, and the methodology page is explicit that broad-market heuristics do not fit every industry.
Intrinsiqq vs other research tools on SaveOnTrading
SaveOnTrading also covers research platforms such as Simply Wall St, Fast Graphs, Koyfin, Chartloom, and Fiscal.ai. Intrinsiqq’s differentiation is the combination of a transparent eight-check Quality Score + editable two-stage DCF + dividend safety score + SEC EDGAR-sourced financials, with a real Free tier (no account required to look up a ticker) and paid plans that start around $12/month before our partner code.
Trade-offs to weigh: coverage is company-level only (no ETFs). Free lookups, history, and charting are capped. The DCF is not available on every name. Chartloom leans into AI 10-K/10-Q summaries for US stocks; Koyfin is broader for dashboards and advisor-style reporting; Simply Wall St is a different visual-quality job. Intrinsiqq is the “show me the working from the filings” workstation.
Limitations
- Not investment advice and not a buy/sell signal. Scores describe quality, valuation, and trend against a fixed checklist.
- US financials come from SEC EDGAR XBRL; companies tag the same concept differently over time, so occasional gaps or mismatches are possible. Intrinsiqq documents fallbacks on the methodology page.
- No forward analyst estimates. Historical filings plus your DCF assumptions — not Wall Street consensus.
- Free daily lookup, watchlist, history, and charting caps. Serious screening, compare, and portfolio work usually means Pro or Premium.
- Portfolio tracker is CSV/manual, not a live broker sync. Individual stocks only — no ETF distributions.
- Not a brokerage or execution platform. You still trade (or not) at your own broker.
Affiliate disclosure
Links to Intrinsiqq on this page are affiliate links (paid links). If you subscribe after using them or the SAVEONTRADING code, SaveOnTrading may earn a commission. The 20% partner discount still applies to you — commission is paid by Intrinsiqq, not added to your price. Intrinsiqq provides research and market data tools only; nothing on this page is financial advice or a personal recommendation. See Intrinsiqq’s Terms of Service and methodology page for the vendor’s own rules.
How the SaveOnTrading offer works
Open Intrinsiqq through our partner referral page at intrinsiqq.com/r/saveontrading, choose Pro or Premium, and enter code SAVEONTRADING at checkout for 20% off. Confirm the discounted total on Intrinsiqq before you pay — list prices and promotions can change, and partner codes are not stackable with other promotions. Free stays free.
How to redeem
- Click the partner link on this SaveOnTrading deal page (the referral page is required for tracking).
- Look up a ticker for free — no account required — and read the Quality Score, DCF, and financials.
- When you want the screener, editable DCF, advanced charts, or portfolio tracker, create an account and choose Pro or Premium (monthly or annual).
- Copy code SAVEONTRADING from the sidebar on this page, paste it at checkout, and verify 20% off applies.
- Cancel anytime from account settings if it is not a fit; access continues through the current paid period.
/ FAQ
Common questions about Intrinsiqq
8 questions