About Chartloom
Chartloom is an AI-powered stock research and financial analysis platform for US-listed equities. It is built so individual investors can research a company in one workspace instead of bouncing between filings, a screener, a charting tab, and a spreadsheet of scenarios.
The product pitch on Chartloom’s site is straightforward: understand businesses faster with fundamentals, valuation history, interactive charts, and AI-powered research. Search a ticker, read a structured filing summary, confirm the trend in the charts, then stress-test growth and margin assumptions in Scenario Lab.
Chartloom is operated by Creative Syndicates Tech Ltd (England and Wales) and positions itself as a research and market data tool only. It is not a broker, not a registered investment adviser, and it does not provide personalised investment advice. Use it to organise public data — then verify important figures against SEC filings and make your own decisions.
Key features
From Chartloom’s live product and pricing pages (Free vs Pro):
- AI SEC summaries: 10-K and 10-Q filings distilled into a business overview, plus moat and risk coverage on Pro, so you can decide which sections of the original filing to read in full.
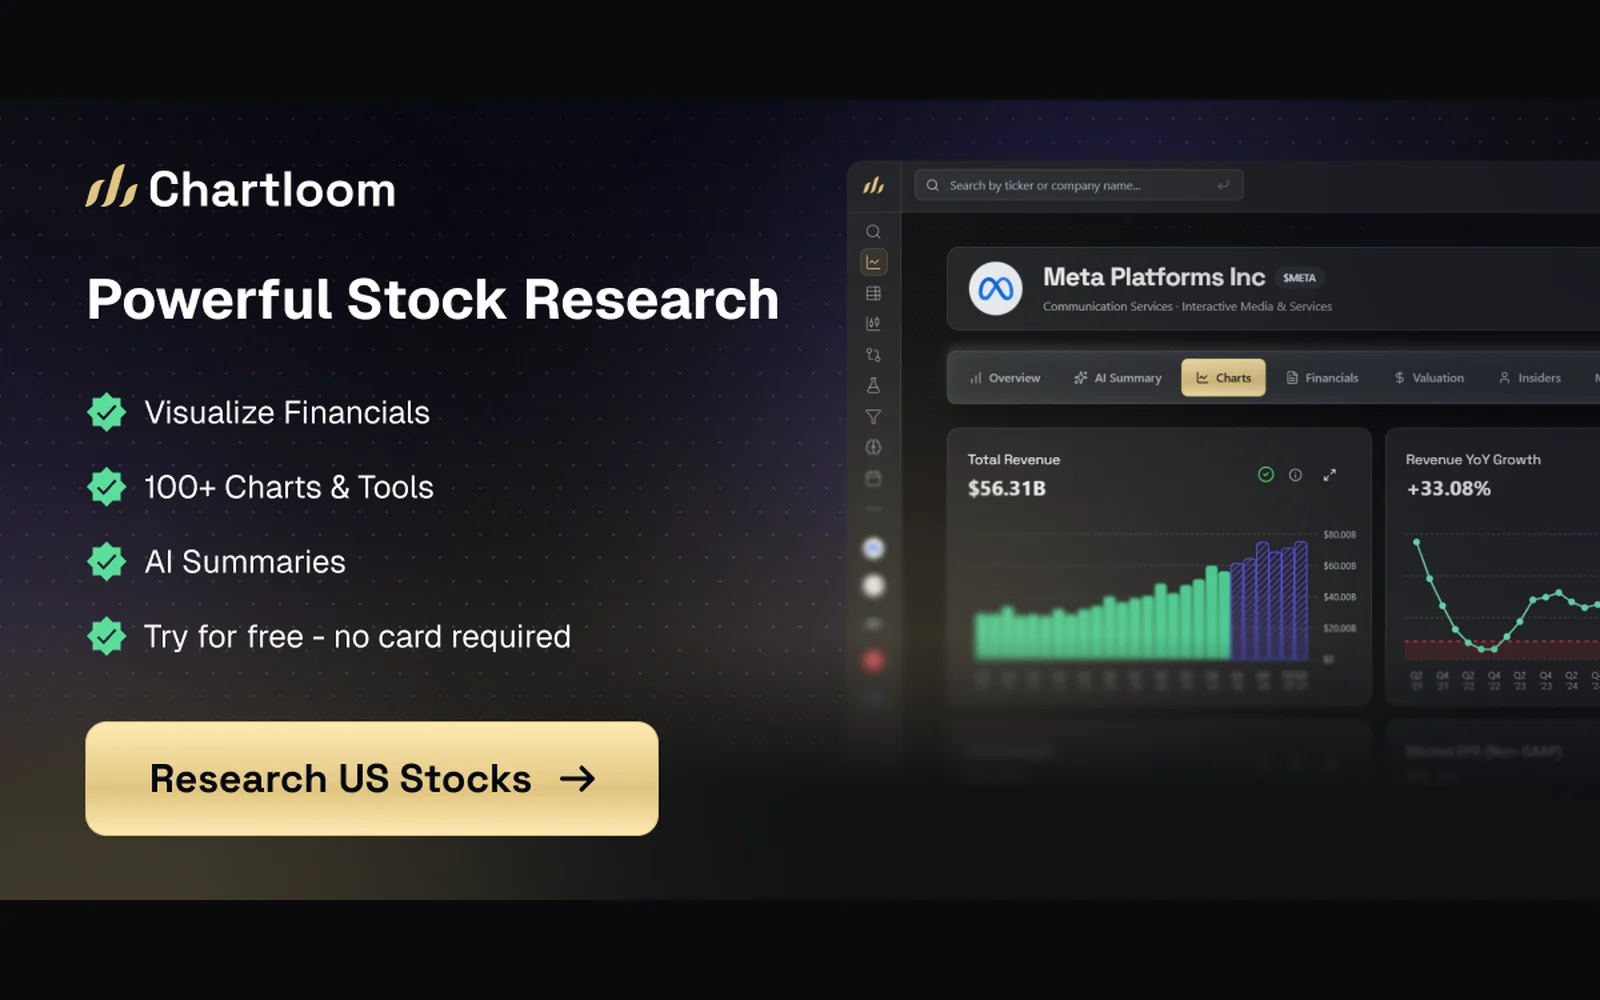
- 100+ interactive charts: visualise 20+ years of annual fundamentals and 40+ quarters on Pro across revenue, margins, cash flow, valuation, and more. Charts can be exported as PNG for notes or sharing.
- Scenario Lab: model bull, base, and bear cases by adjusting growth, margins, multiples, and optional DCF inputs, then watch estimated outcomes update.
- US stock screener: filter 5,000+ US-listed stocks on Pro (Free includes a limited preview).
- Compare up to 3 stocks: side-by-side metric cards and a summary table, with saved comparison history.
- Valuation context: historical multiples, analyst consensus, price targets, and fair-value style charts so a P/E is read against the company’s own range — not in isolation.
- Portfolio, watchlists, and DCA: track holdings, dividends, and dollar-cost averaging. Pro unlocks fuller portfolio metrics; Free is capped (1 portfolio / 15 holdings, 1 watchlist / 8 stocks).
- Insiders, earnings, and workflow: earnings calendar on both plans; insider activity, valuation alerts, notes, and a customisable dashboard on Pro.
Chartloom’s own research guide walks a six-step loop: AI summary → charts → valuation range → insider/analyst context → peer compare → Scenario Lab. That is the workflow the product is designed around — not tape reading or order entry.
Plans and pricing
From Chartloom’s live pricing page and Terms (confirm totals at checkout):
- Free — $0 forever: browse any US stock, about 10 years of financials, 8 charts per company, compare up to 3 stocks, and AI business overviews. No card required.
- Pro — $10/month: 20+ years / 40+ quarters of financials, 5 years / 20 quarters of KPI data, 100+ charts, AI analysis (business, moat, and risks), US screener across 5,000+ stocks, Scenario Lab, DCF projections, advanced watchlists, valuations, alerts, insider data, and full portfolio tracking.
New accounts get 14 days of Pro with no credit card and no automatic charge. When the trial ends you can stay on Free or subscribe to Pro. After a paid Pro subscription starts, Chartloom also offers a 14-day money-back guarantee — contact support if it is not the right fit. Cancel anytime from account settings; access continues through the current billing period.
Chartloom previously sold a limited Founding 100 rate of $7/month locked for life. Per Chartloom’s Terms, that early-adopter rate is closed to new subscribers (existing founding members keep it while the subscription stays active).
SaveOnTrading’s partner offer is 25% off your first month of Pro when you start from our branded referral page. On the current $10/month Pro price that is a first month of $7.50, then the regular Pro rate unless another offer applies. There is no separate coupon field — the discount is attached through the referral link. Free stays free.
Who it's for
Chartloom fits self-directed investors who research US stocks and want filings, charts, valuation history, and scenario testing in one browser workspace:
- Long-term and growth investors who start with the business story, then confirm it in the numbers
- Anyone who currently pastes 10-Ks into a chat tool and wants a filing summary that sits next to the actual charts
- Investors comparing Chartloom with higher-priced research platforms such as TIKR, Koyfin, or Morningstar, but who mainly need US coverage
It is not a day-trading scanner, Level 2 tape, options-flow terminal, or broker. If you need global markets, earnings-call transcripts, or open-ended AI chat, Chartloom’s public comparison table lists those as limited or on the roadmap — pair it with another tool or wait for those features.
Chartloom vs other research tools on SaveOnTrading
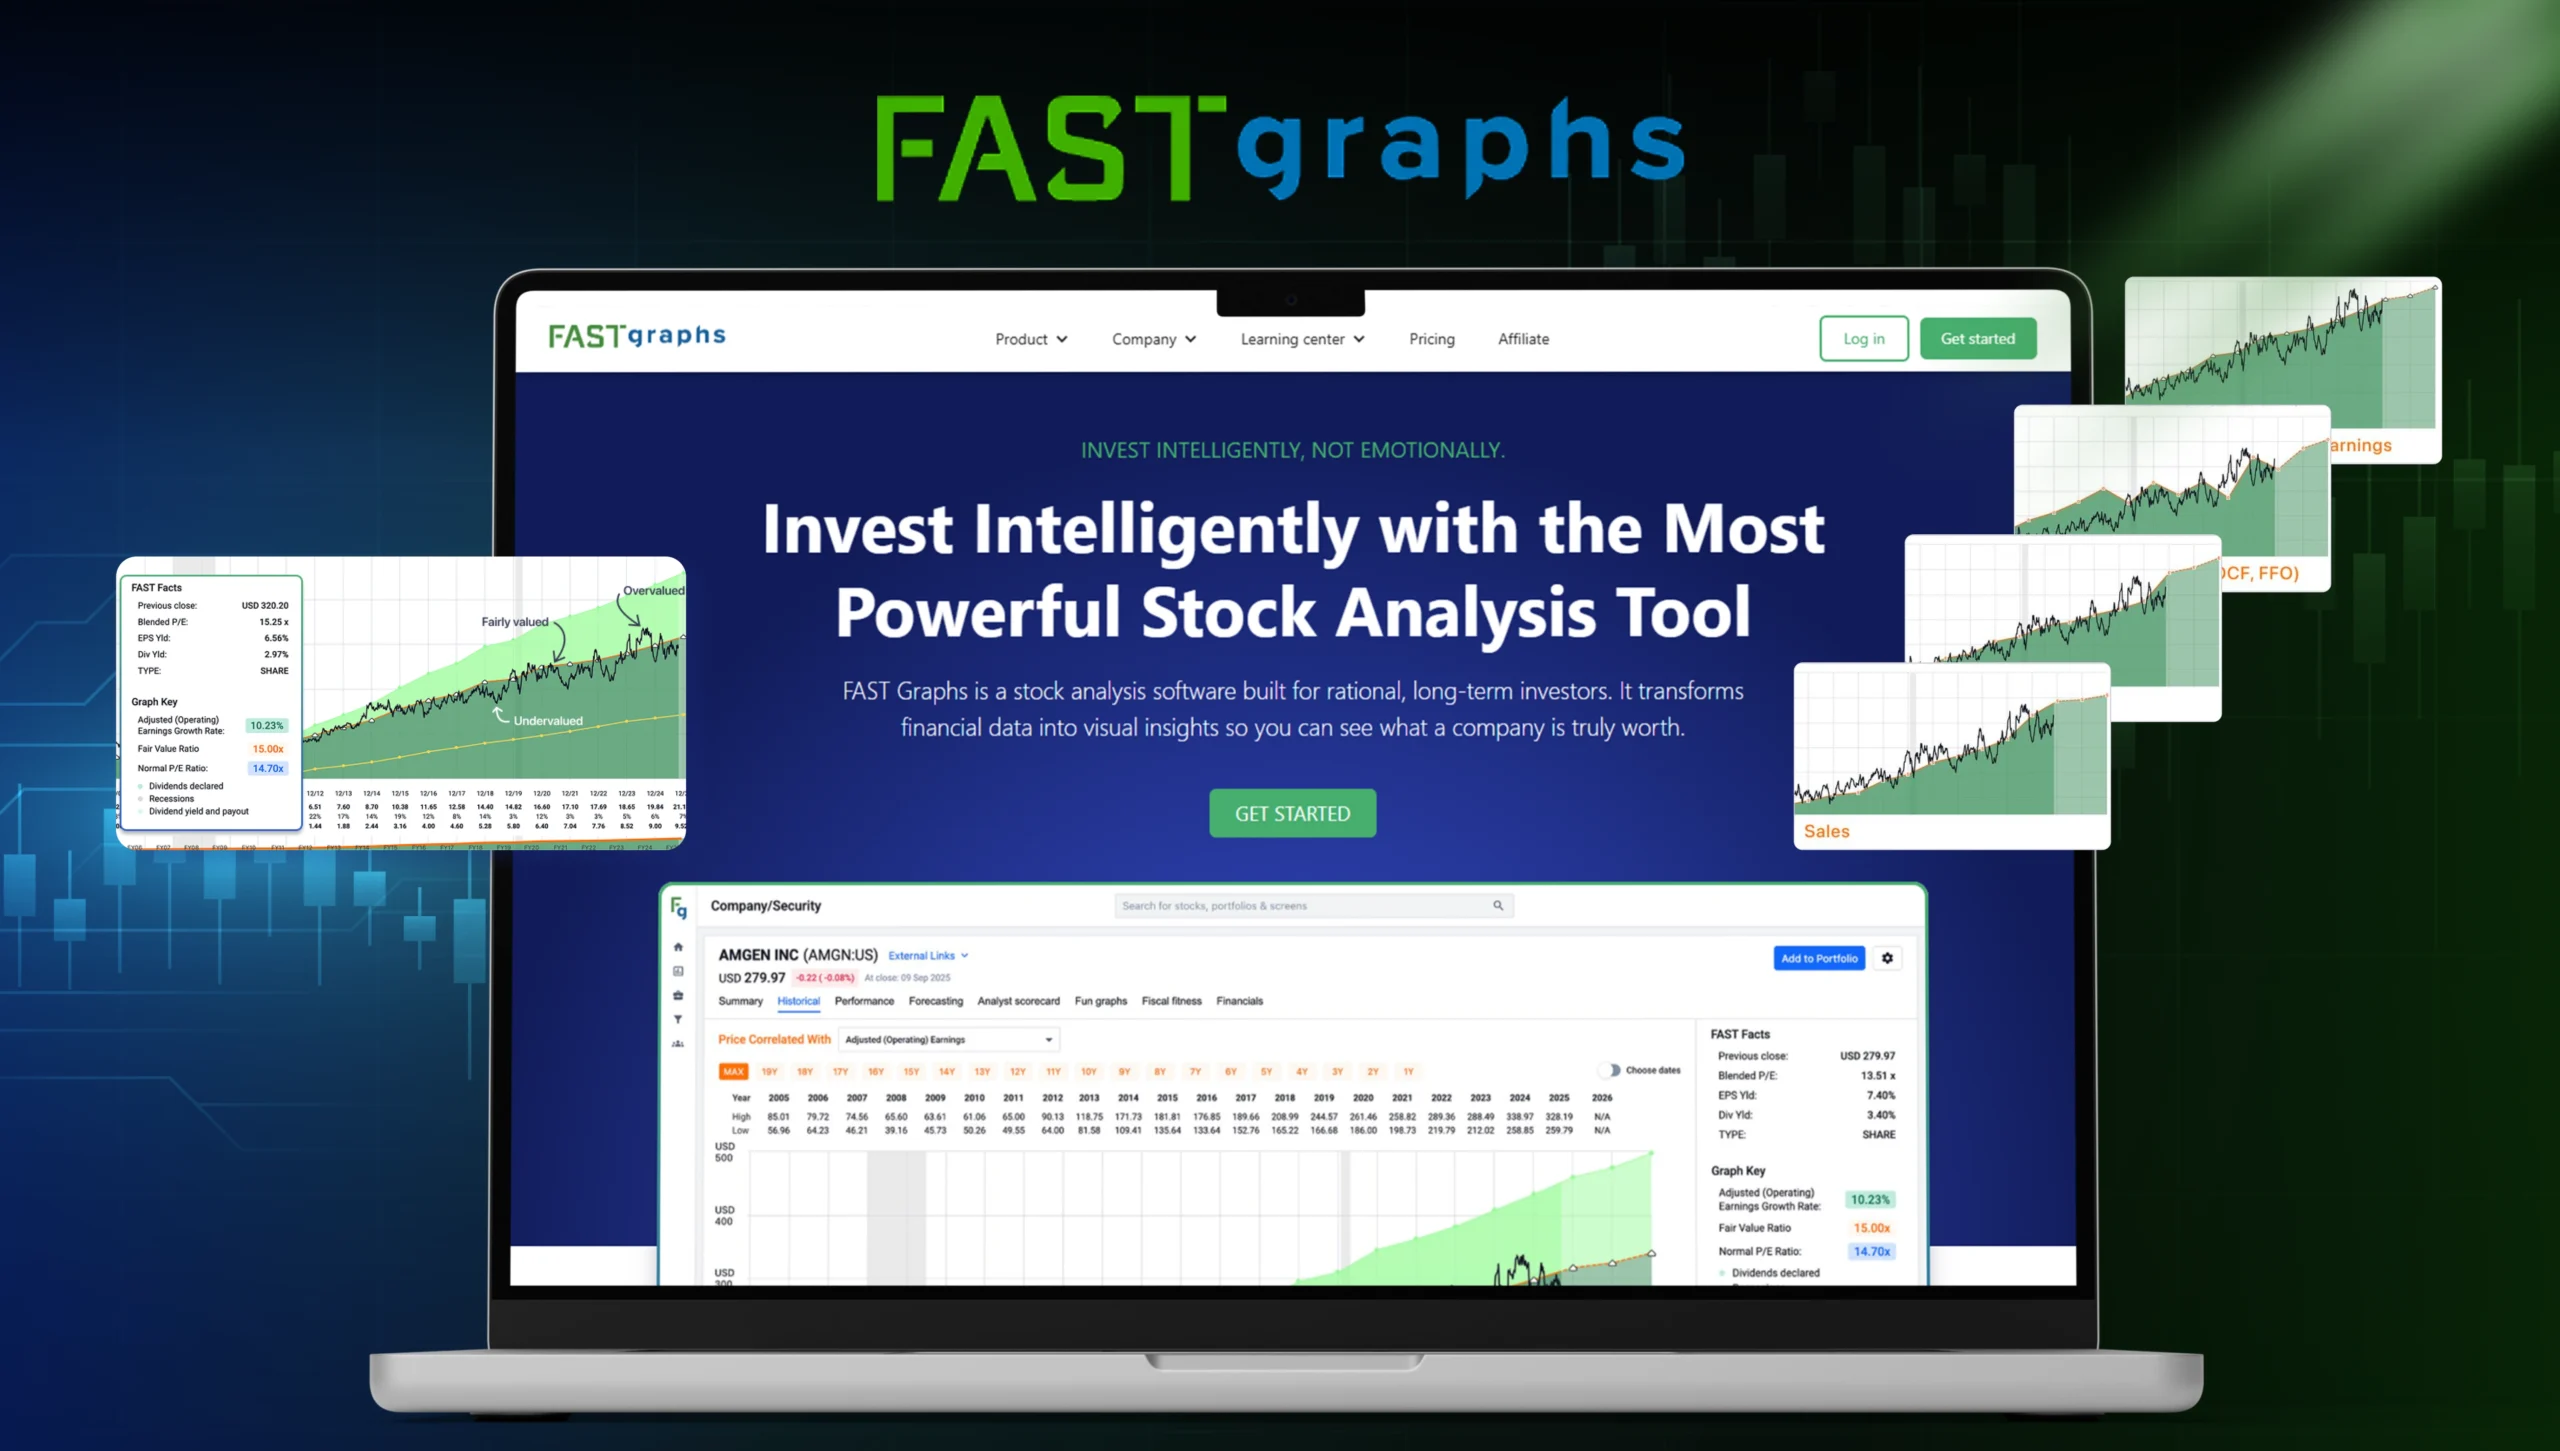
SaveOnTrading also covers research platforms such as Koyfin, Simply Wall St, Fiscal.ai, and Fast Graphs. Chartloom’s differentiation is the combination of AI 10-K/10-Q summaries + 100+ fundamental charts + Scenario Lab + a $10/month Pro plan, with a true Free tier and a no-card 14-day Pro trial.
Trade-offs to weigh before you subscribe: coverage is US-listed stocks only (about 5,000+ names). Earnings-call transcripts are listed as not included (roadmap). Open-ended AI chat is not included. If you need global markets or advisor-style reporting, Koyfin or a terminal-style product may fit better. If you only want visual snowflake-style quality scores, Simply Wall St is a different job.
Limitations
- US-listed equities only — no global market coverage on the public comparison table.
- AI summaries are research support, not a substitute for the full filing. Chartloom says to verify figures against primary sources.
- Scenario Lab and DCF outputs are hypothetical models based on assumptions and historical data — not forecasts or personal recommendations.
- Free caps charts, history, screener, watchlists, and portfolios; serious research usually means trying Pro during the 14-day trial.
- Not a brokerage or execution platform. You still trade (or not) at your own broker.
Affiliate disclosure
Links to Chartloom on this page are affiliate links (paid links). If you subscribe after using them, SaveOnTrading may earn a commission. The 25% first-month Pro discount still applies to you — commission is paid by Chartloom, not added to your price. Chartloom provides research and market data tools only; nothing on this page is financial advice or a personal recommendation. See Chartloom’s Terms (affiliate programme) and Important Disclaimer for the vendor’s own rules.
How the SaveOnTrading offer works
Open Chartloom through our partner referral page at chartloom.com/r/saveontrading. That branded page applies 25% off your first month of Pro after the 14-day free trial. No coupon code is required. Confirm the discounted first-month total on Chartloom before you pay — list prices and promotions can change. Renewals bill at the regular Pro rate.
How to redeem
- Click the partner link on this SaveOnTrading deal page (the referral page is required for the 25% off).
- Create a Chartloom account and start the 14-day Pro trial — no credit card required.
- Research a few US tickers: open an AI summary, scan the charts, and try Scenario Lab.
- If you want to continue on Pro, activate the paid plan from that same referred account so the first-month 25% off attaches.
- Or stay on Free forever if Pro is not a fit. You can also request a refund within 14 days of first paying, per Chartloom’s satisfaction guarantee.
/ FAQ
Common questions about Chartloom
8 questions