Stock Analysis is a research site for people who read the business before they buy the stock. It covers more than 150,000 stocks and funds, with prices, news, financial statements, analyst forecasts, charts, and screeners. The site says more than 5 million investors use it in a month.
The free pages are enough for a lookup. You can open a quote, read the news, and pull up a chart without paying. Pro is where the history gets long, the screener can be saved, and an ETF's holdings go past the top of the list. Unlimited is the same product with the caps taken off downloads, watchlist size, alerts, and the analysts you follow.
Here is what you actually get, and what the annual discount changes at checkout.
1. Company financials
Open a stock and the financials page is a set of tables, not a filing dumped into the browser. The overview starts with revenue, gross profit, operating income, net income, and earnings per share. Under that is revenue by segment, then cash and debt, cash flow and capital spending, margins, dividends, and valuation ratios such as the PE, the forward PE, price to free cash flow, and price to sales.
A growth rate sits next to the dollar figure. You can flip a series from the table to a chart, and switch annual figures for the trailing twelve months. On a company that reports segments, those lines are in the same table as the total, so you can see which part of the business actually moved.
The free view is the recent years. Pro extends it: 10 to 40 years of financials, and 10 to 50 years of dividends, both still being extended. Pro also includes the corporate-actions history and a longer run of business metrics on 50,000+ stocks. The fiscal year on the page is the company's own, so a September year-end does not get forced into a December column.
Check it out here: Stock Analysis
2. Stock screener
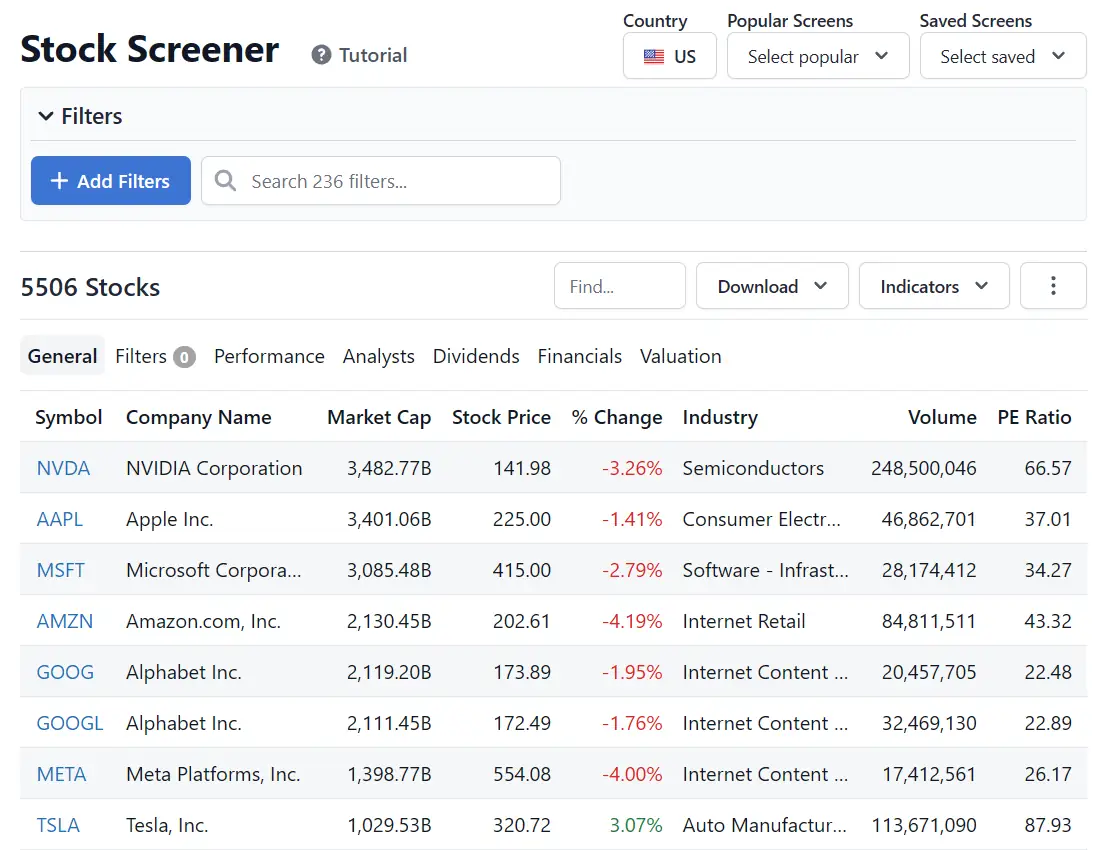
There are three screeners that work the same way: stocks, ETFs, and IPOs, plus a mutual-fund screener. You start with a country. The default is the main U.S. exchanges. Names listed outside the U.S. have fewer columns, because some of the data vendors do not supply those fields. The ETF screener only offers countries that actually have ETFs listed.
A filter is one indicator. You search the name, or open the full list and tick the ones you want. Their tutorial puts the count above 200. A number filter can be over, under, between, exactly, or not zero, and a large number takes a K, M, or B on the end. Index membership is a single choice, such as the S&P 500, the Nasdaq 100, or the Dow. Sector, industry, and exchange take more than one. The table updates as you set the values.
Seven views change the columns: General, Filters, Performance, Analysts, Dividends, Financials, and Valuation. You can edit those columns, sort a header, and search inside the result list. A popular screen drops in a ready-made set, such as dividend growth. Pro saves your own screens so you can switch between them instead of rebuilding the filters. On the paid plans, data tables go to 300+ indicators and up to 1,000 rows. Lists elsewhere on the site, such as the day's top gainers, can be opened in the screener with those filters already applied, and then narrowed further.
Check it out here: Stock Analysis
3. Analyst forecasts
The forecast page leads with the consensus, then the individuals. You get a rating word, an average target, and the low, median, and high, each with the percent gap to the current price. A month-by-month table counts strong buy, buy, hold, sell, and strong sell, so you can see whether the rating drifted. Under that, each note lists the analyst, the firm, what they did (maintains, downgrades, reiterates), the target, and the date.
Price targets and the consensus come from S&P Global Market Intelligence. The individual rows come from TipRanks. Further down is the financial forecast: revenue and EPS for this year and next, then a year-by-year table of revenue, margins, income, dividends, and the forward PE. The later years on that table are marked Pro. The high, average, and low estimate for revenue and for EPS is the same way. Pro can filter the set down to the analysts with the better track records.
You can also follow an analyst and get a note when they publish. Pro follows up to 25. Unlimited does not cap the follows.
Check it out here: Stock Analysis
4. ETFs and funds
An ETF page is the quote plus the holdings. The top of the holdings view gives the number of positions, how much of the fund sits in the top 10, the asset class, assets, and a PE, then a breakdown by sector, asset class, or country. The table under that is the names: symbol, company, weight, shares, and price. Holdings come from Finnhub. The issuer usually publishes them at the end of the day, and the page says when it last checked.
The free view is the top of that list. Pro opens the full holdings, not a top-10 cutoff. The ETF screener uses the same filters as the stock screener. A comparison tool puts funds next to each other. There is a separate mutual-fund screener if the product is a fund rather than an ETF.
Check it out here: Stock Analysis
5. Watchlists and portfolios
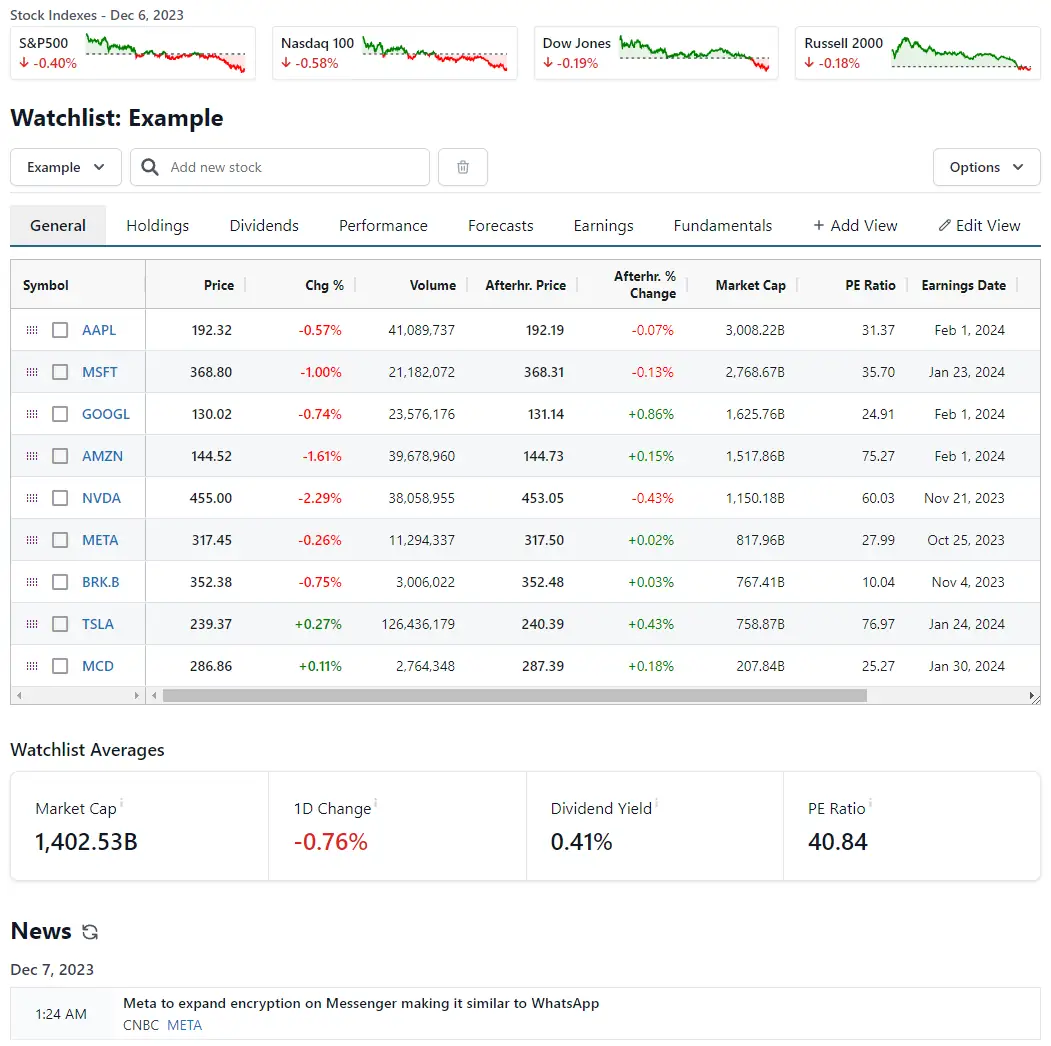
A watchlist is a table you build. Across the top of the example list are the index tapes: the S&P 500, the Nasdaq 100, the Dow, and the Russell 2000, each with the day's change. Then the symbols, with price, change, volume, the after-hours print, market cap, PE, and the next earnings date. Tabs change the columns: General, Holdings, Dividends, Performance, Forecasts, Earnings, and Fundamentals. You can add a view or edit one. Under the table, averages cover market cap, the one-day change, dividend yield, and PE. News for those symbols sits at the bottom.
Type a share count and an average cost and the same list becomes a portfolio. The averages turn into a summary: the portfolio value, today's profit and loss, dividend yield, and PE, with a cash line if you enter one. Pro can sync the holdings from a brokerage instead of typing every lot. Pro allows any number of lists, with 100 symbols on each. Unlimited removes the 100-symbol cap.
A summary can go out by email or as a push in the app. Daily summaries send about 15 minutes after the close. Weekly and monthly summaries send on the evening of the last session in the period. A list with no share counts still gets one: the average move, and which names moved the most. If three or more lists are due at once, they arrive in a single email. Free accounts get the summary on one list, Pro on up to 10, and Unlimited on any number. That summary cap is separate from the 100 active price and news alerts on Pro.
Check it out here: Stock Analysis
6. Charts, calculators, and downloads
The chart page has a technical chart and a fundamental chart. On the technical chart, the axis can plot price instead of percent change: hover the axis, open the menu, and turn percent change off. Colors live in the preferences cog at the top right, including a dark theme, which is a Pro option. A saved watchlist can sit in the chart sidebar so you move between names without going back to search.
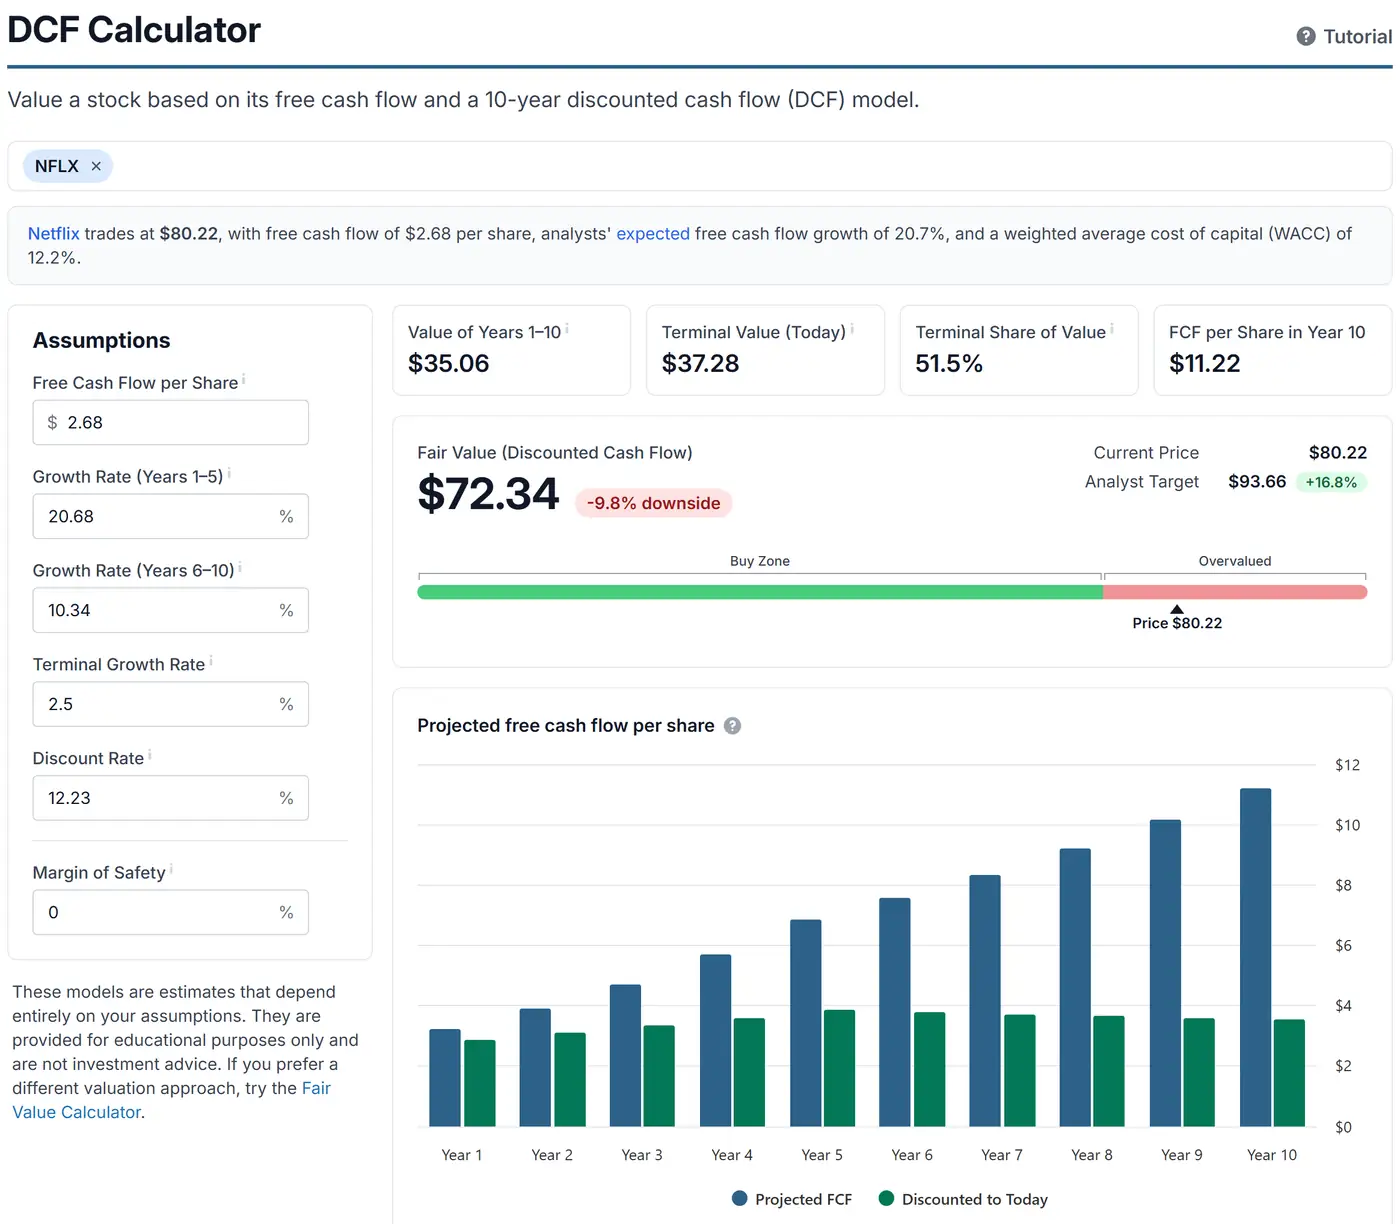
Two calculators sit next to the charts. The discounted-cash-flow calculator takes free cash flow per share, a growth rate for the first five years, a growth rate for the next five, a terminal growth rate, a discount rate, and a margin of safety. It puts a fair value next to the current price and the analyst target, and a bar chart shows the projected free cash flow against the same cash flow discounted back to today. The fair-value calculator is the other model, if you do not want to build it from cash flow. Both pages say the result is an estimate and not advice.
A download sends the table you are looking at to Excel, CSV, or Google Sheets. Some columns are left out of the file because the data vendor does not allow them. Pro includes one download a day. Unlimited does not limit downloads. Alerts follow the same split: 100 active alerts on Pro, and no cap on Unlimited.
Check it out here: Stock Analysis
7. What it costs
The annual discount is already on the price. Annual Pro is 30% off the first year. Annual Unlimited is 50% off the first year. Checkout does not ask for a code. Monthly plans stay at the regular price. After the first year, the annual plan renews at the regular price. This price is on the site through December 2, 2026 at 11:59 PM ET.
| Plan | Regular price | First year through Dec 2 |
|---|---|---|
| Pro, monthly | $9.99 a month | $9.99 a month |
| Pro, annual | $79 a year | $55.30 |
| Unlimited, monthly | $29 a month | $29 a month |
| Unlimited, annual | $199 a year | $99.50 |
Twelve months of Pro at $9.99 is $119.88. The regular annual plan is $79, which Stock Analysis describes as four months free. Through December 2, the first year is $55.30, or $4.61 a month, against $6.58 a month at the regular annual rate. The annual plan renews at $79.
Unlimited is $199 a year at the regular price, or $99.50 for the first year through December 2. It is the same site as Pro. The differences are the caps. Pro allows 1 download a day, 100 stocks on a watchlist, 100 active alerts, and 25 analyst follows. Unlimited has none of those limits. Unlimited monthly is $29 and stays at that price.
Both paid plans come with a 60-day money-back guarantee. That covers the first charge and later renewals at the full annual price. Email support@stockanalysis.com and they refund it. You can cancel from the account page, or send them a message and they will cancel it. Prices move. The number on their checkout page is the one that counts.
- Open Stock Analysis from this page, so the visit is tied to the offer.
- Choose annual billing. Pro is 30% off the first year. Unlimited is 50% off the first year. The discount runs through December 2, 2026 at 11:59 PM ET.
- Confirm the total at checkout. The price is already discounted.
Check it out here: Stock Analysis pricing
Who it's for
Investors who want the statements, the forecast, and the holdings in one place before they size a position. A free account covers a quote, a chart, and a first pass at the screener. Pro is the point where the history gets long, a screen can be saved, a brokerage can fill the portfolio, and an ETF's holdings are the whole fund rather than the top of the list.
It is not a broker, and it cannot place an order. There is no scanner here that fires as each trade prints. If that is the tool you need, this is the wrong page. Day traders will still want their broker's platform.
Thank you for reading.
— SaveOnTrading
P.S. Annual Pro is 30% off the first year and annual Unlimited is 50% off the first year, through December 2, 2026 at 11:59 PM ET. The price is already discounted. Confirm the live total at checkout. Open Stock Analysis.
/ FAQ
Common questions about Stock Analysis
7 questions