About Finviz
Finviz is one of the most widely used stock visualization and screening sites for U.S. equities (NASDAQ, NYSE, AMEX). The free site is famous for heat maps and a fast screener. Finviz Elite upgrades that workflow with real-time quotes, intraday charts, advanced filters, ETF holdings depth, exports/APIs, and an ad-free UI.
Market visualization and stock screener with heat maps, real-time maps, and advanced filters for active equity traders.
Screen U.S. stocks on 70+ criteria, map sector performance, and track insider, earnings, and news feeds in one fast visual dashboard for daily research.
SaveOnTrading lists Finviz because traders actually pay for this category of tool — and partner pricing can materially change the annual cost if you were going to buy anyway.
Key features
- Real-time data including premarket (4:00–9:30 AM) and after-hours (4:00–8:00 PM) quote sessions
- Interactive multi-layout charts with saved technical studies and pattern tools
- Advanced screener: 20+ extra customizable filters, larger result pages, more presets (up to 200), ETF filters, stats views
- ETF research: full holdings breakdown and structural metrics — not only the top 10
- Alerts: email and push for price, news, ratings, insider trades, and SEC filings
- Exports and APIs: pull screener, portfolio, groups, options, and news data into Excel, Sheets, Python, or JS
Focus on the smallest set of features that match your process. Most traders overbuy tools and underuse them; the goal is a tighter workflow, not a larger subscription stack.
Plans & pricing
Confirm live pricing on the vendor site at checkout.
Vendor list prices and promotions change. Treat any dollar amounts as directional until you confirm them on the live checkout page after following our partner link.
Who it's for
Active U.S. equity traders and investors who live in heat maps and screeners — especially if delayed data is costing you entries around the open. It is less ideal if you need global markets, broker execution, or deep alternatives data.
If you cannot describe a weekly use case in one sentence, wait. The best discount is still a bad purchase if the tool sits unused.
Limitations
Confirm plan limits and data coverage on the vendor site before you rely on it for live risk.
No research terminal, scanner, journal, or newsletter removes the need for risk management. Use these pages to choose tools — not as trade recommendations.
Related research and ranking tools
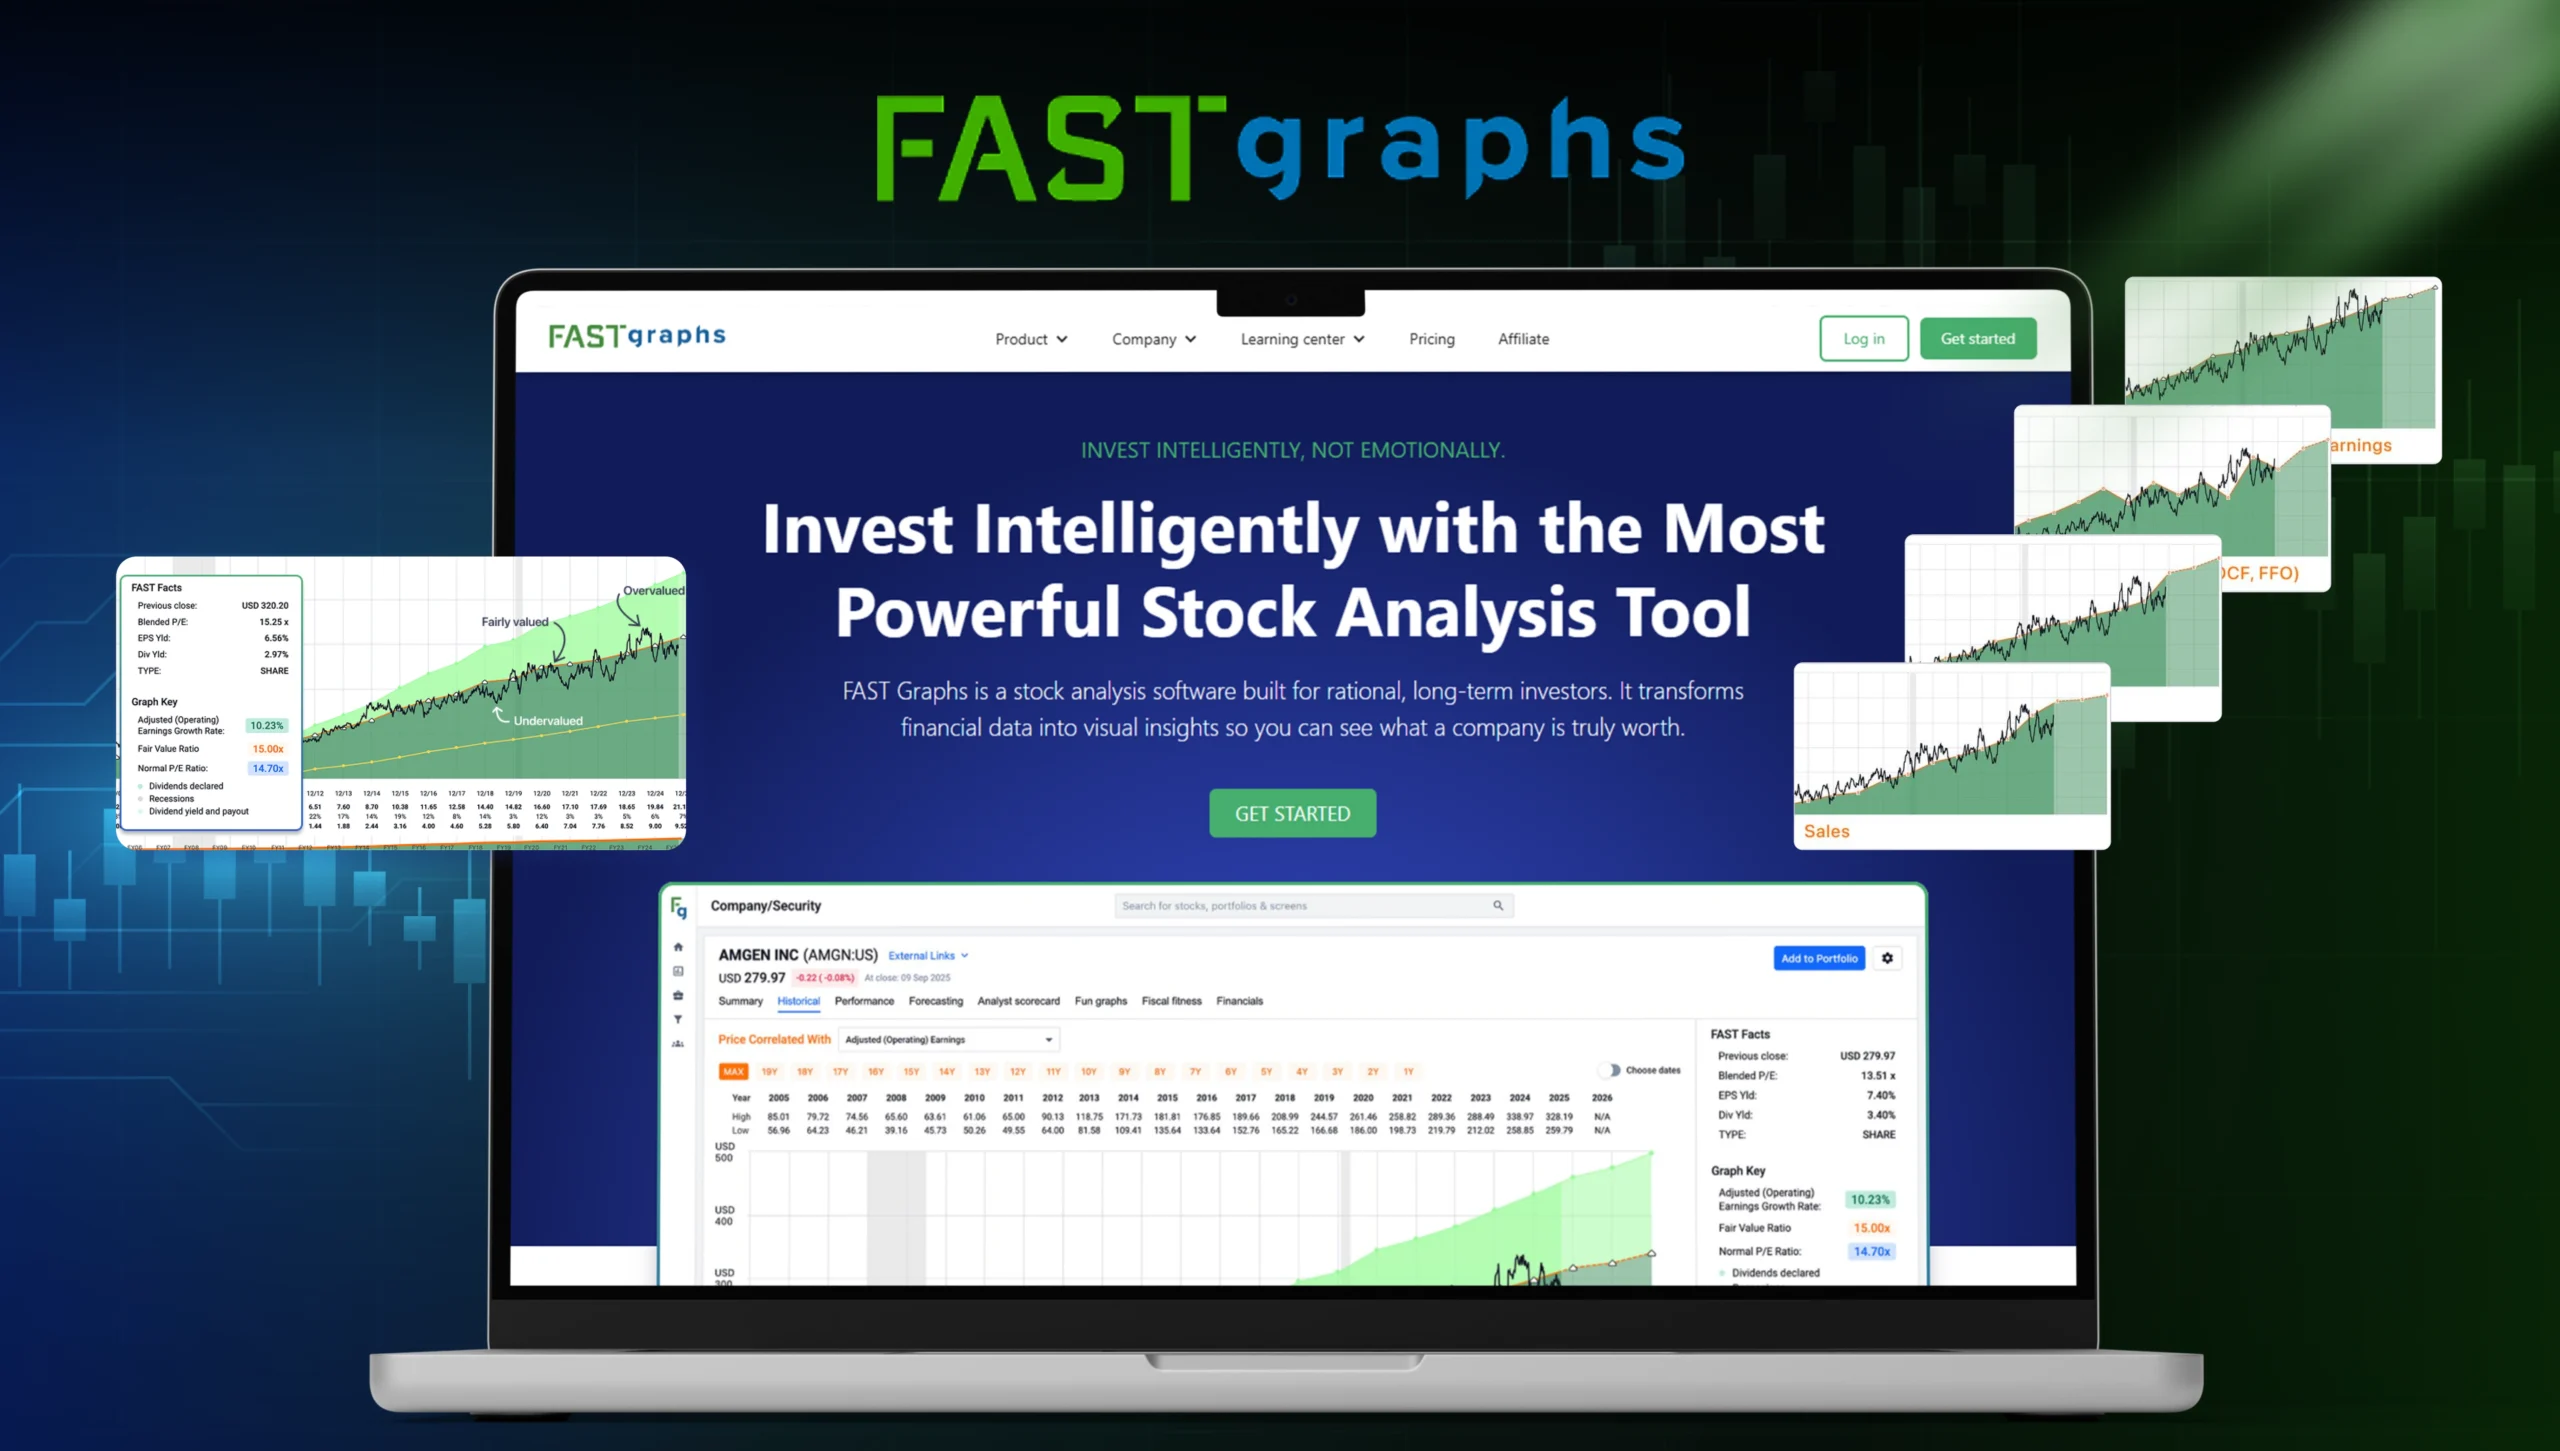
Finviz is the fast visual screener. For portfolio Snowflake visuals see Simply Wall St; for earnings/valuation charts see Fast Graphs; for AI rankings see Danelfin; for options flow see Cheddar Flow.
How the SaveOnTrading offer works
Save 33% on Finviz Elite through SaveOnTrading partner pricing. Use our partner link to redeem at checkout.
Always start from this page so tracking and partner pricing attach. If a code is listed, copy it here and enter it at checkout. If the offer is link-based only, the discount should appear after using our partner URL.
When you evaluate this tool on SaveOnTrading, start with the partner link on this page so the discount attaches. Then decide whether the product fits your actual workflow — not every popular tool belongs in every stack.
A practical checklist before you pay:
- Does this solve a bottleneck you hit weekly (research speed, risk checks, journaling, news, scanning)?
- Can you name the exact workflow you will use in the first 7 days?
- What existing tool does it replace or complement?
- Have you confirmed current plan limits and cancel/refund terms on the vendor site?
/ FAQ
Common questions about Finviz
6 questions